Table of Contents
Creating and Modifying Reports in CATS
CATS allows full customization of reports. This page will serve as a detailed description of how to create reports in CATS. This guide will get you started with understanding how reports work and how you can use them to make the most out of your CATS data. Users can change the filters, columns, and order format to control which records, which information about those records, and in what order records are displayed on the report.
Choosing a Report
The first step is determining what type of report you want to use. For the purposes of this tutorial, we will be taking a look at creating a Traffic/Insurance report. Traffic reports use information from location screens to display your current position. A single traffic screen is considered one record on the report.
From the main menu, pick Position Reports > Traffic/Insurance.

CATS will display a list of previously created and saved formats to choose from.
All reports in CATS are stored as saved report formats. There is no limit to the number of formats you can store in CATS. Users can also take ownership of report formats and prevent other users from changing them.
If you click on a report name, you can see details about that report.

In the red box, we see a list of currently applied filters and their values. In the green box, we see details on who last saved the report and when it was last printed. Items highlighted in blue in the list indicate a favorite report for your user ID. See the wiki on Recent and favorite reports for more details.
Modify - Choose modify to make changes to an existing report.
Print - Print without changing any parameters.
Blank - Create a new report by clicking blank.
Close - This will close the select format screen and go back to the previous screen.
Buttons on the right are available for quick printing: Printer, HTML, Excel or PDF.
Click the Modify button to continue to the report designer.
The Report Designer Screen
CATS will display all currently selected filters, orders, and columns for this report.

The different parts of the screen are broken down into different functions: Title/Options, Actions/Settings, Orders, Filters, and Columns.
Title, Icons, and Actions
First, we will take a look at top-level options, at the very top of the screen.

Here we have settings that will affect what records are shown on the report, as well as actions we can take to change the report.

From left to right, we have:
- Title - An optional field you can fill out to have CATS label this report.
- As Of Date - If this date is filled in with a date other than the current date, CATS will attempt to pick out the information on certain records and filters to match that date. For example, if you print an accounting report that asks for open invoices as of the end of last month, CATS will make the appropriate adjustments. It is not able to reset data or remove data from fields.
- Detail/Summary - This dropdown box allows you to see either every record (Detail), or just the records for the subtotals you have set in the Orders section (Summary).
- Icons - Several actions are available here:
 1. Copy: Copies all of the settings (filters, orders, and columms) from another saved report format. CATS will call up the list of saved reports and ask you to select one to copy from.
 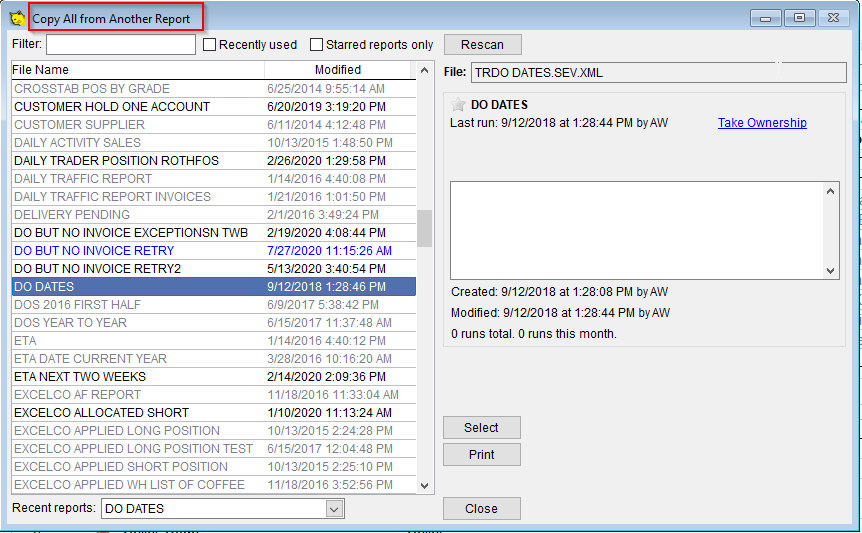 Select a report to copy from this list.
 2. Printer Settings: Calls up the printer settings dialogue, which will allow you to change the paper printout options for this report. Options changed here will be saved for this one report format only.
 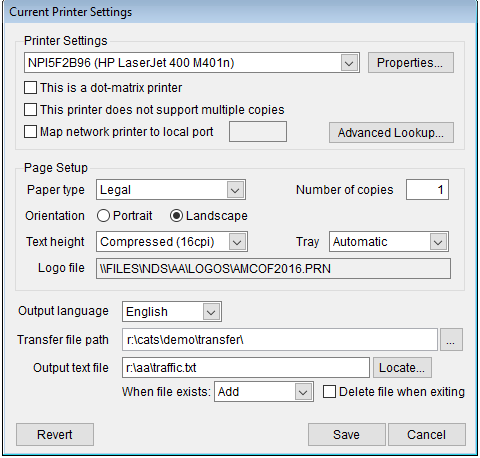 Printer Settings Dialogue
 3. Report/Output Settings: Opens up a box with both paper and HTML format options. See the section on Report Settings below.
 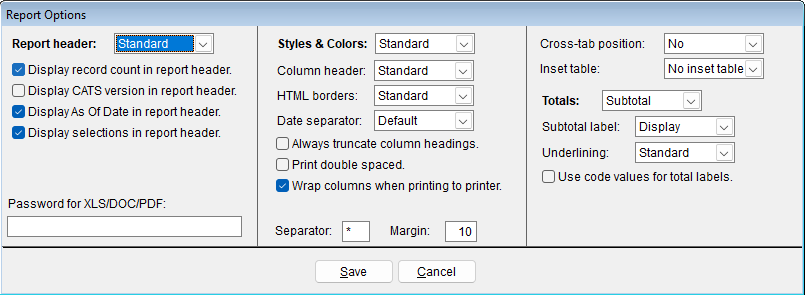 Report Designer Settings Box
 4. Mark as Favorite: If you click the star, CATS will mark this report format as a favorite. You will see it listed in your favorites on the homescreen and in the list of saved formats for this type.
  5. Save Report Format: Save the current configuration with the same name or a different one.
 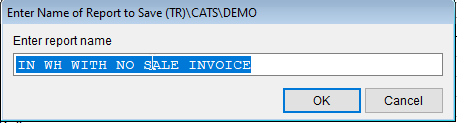 Save report with a name.
- Reset - If you there are unsaved changes to the current report, you can reset the changes you have made to the last saved state.
 Reset all changes confirm
- Take Ownership: If your company is using the Report Manager module, you will see and be able to click this box, which means only your CATS user ID can save over this report.


Changing Filters
In the top left section, you can see the filters currently selected for this report. The Filters let you limit which records will appear on this report.

Here is a review of all these options in more detail.

To the right of the Filters label, the number displayed (8) is the current number of filters you have set for the report.
- Search: Enter a value in the blank search box to search for filters.
- Add: Use either of the green + signs to add another filter.
- Remove One: Click on the red - sign to reset a particular filter to its default value, such as All.
- Copy: The paper icon will allow you to copy a set filters from another report.
- Remove All: Remove all will remove all the filers so you can start new.
To change a filter currently set, simply click on a dropdown box and change the value selected. If you are required to enter a value, you will be given a dialogue to do so.
Filter Options
If you click on the dropdown arrow for a particular filter, you will see the options available for that filter. Most filters have similar options, though Date filters have more specific options. See more about filter options here.
- Select: Enter a code or a range in the provided fields If you have already selected Warehouse type report, you must either enter WH in the First field space or leave it blank. If you enter a conflicting code (such as AF or IN), CATS will give you a warning and may not print the desired records.
- Exclude: Enter any code to exclude records matching that code from the report.
- Match, we can write in the codes of several warehouses whose records we want to see, separated by a || character.
- MatchExclude works in a similar way to the Match filter, only excluding multiple codes instead of one.
Adding Filters
Click on the green + sign to open up the list of unused filters.

Search using the blank box.
See filters based on the old list of pages by using the Page dropdown arrow.
Use the scrolldown bar to see more filters.
Use a dropdown arrow to set a filter, or click on the green button to add that filter to the report.

Here, we can see that when we select Any Date for the DO Date filter, this filter gets added to the list of used filters.

Keep adding or changing filters as needed to get the records you need.
Setting Up Groups & Subtotals
Under the Groups & Subtotals area, you can set how records are grouped and in what order they are displayed within each group. In the top right section, you can see a list of subtotals and groups available for this report format.

Grouping names with numbers to the left of them are selected for this report.
Adding and Removing a Grouping
Enter a number to the left of the group name to add that grouping to the report.
You can also click on the green + button to add a grouping.
Use the blank Search bar to look for groups by name.
To remove a grouping, zero out the number or click on the red - button. You can also click on the arrow icons to move the grouping up or down in hierarchy.
Subtotals and Page Break
To Subtotal by a particular group, click the check box. In our example here, we have chosen to subtotal by Account Sale - Buyer, then by Grade/Description. After that, we order by Purchase Contract and Location Screen, with no subtotals on those orders.

Modifying Columns
Columns are the details that CATS will show about each record. You can choose which information to display about the records on your reports using the column selection feature. In the bottom of the screen, you can see a list of the columns available for this report format.

Column values are shown left to right across the top of the reports, with the column numbered 1 starting on the left, 2 the next in line, etc.
Click on a heading in the columns scan (such as “Description”) to sort by that value.
You can also use the search box to find all or part of a column description.
Adding a Column
Enter a number in the Pos column next to each column name that you wish to see on the report. Column names with zeroes will not be printed on the report.
Alternatively, you can click on the green + button to the left of a column name to add it to the report.
You can also use the arrow keys to move a column name up and down in line, which will change its number and thus its position on the printout of the report.
Removing a Column
Simply click on the red - button to remove that column name from the report.
Or, you can put a 0 in the Pos field.
Finally, click on the blue Remove all option to remove all columns from the report.
More Column Options

- The 1st column allows you to enter a character to appear before the values that come from CATS. This helps when you export certain columns to Excel, which can erroneously change the format of a column. A common character to use is
*or. - The letters in the Excel column will tell you which corresponding column this value will display in when this report is printed to Excel.
1in CATS corresponds toAin Excel,2corresponds toB, etc. - Click on the “paper and pencil” icon to customize this column. See the section below on customizing columns for more information.
- The “down green arrow” icon will copy a column, in case you want a column to appear twice on a report (for the purposes of creating an Excel formula, for example).
Total Options
Certain columns will allow you to display totals or other summing information, assuming you have subtotals set to display. Here are the options for totaling columns.

- SUM - Add all of the values in this column to get a total.
- AVG - Display an average all of the values in this column (by adding all values and dividing by number of records).
- DELTA - Display the change in this column vs another column (for cross-tabs only).
- MAX - Show the max value for this column as the total.
- Last - Show the last value in the record for this column
Creating Custom Columns
The CATS report designer allows you to create custom columns, using other columns as a basis.
Here are several uses for custom columns:
- Calculations Based on a Fixed Amount: For example, you could enter a fixed market level per pound, then reference the weight on an open contract and figure out the market value of that material. Or, you could enter a ratio or percentage to use to figure out an insurance factor.
- Relative Column Calculation: In the example below, we see the creation of a custom column that figures out a flat sale-purchase price and multiplies it by the weight on the inventory. You could reference any number of columns and figure out a very complex calculation that is unique to the situation or to your business.
- Custom Formatting for Import/Export of Data: If you work with data in other programs, you can use a custom column to truncate or add information to columns.
First, find the column with the Heading called Blank and the Description of Wildcard column for use with calculated values Click on the green + button to add the column to the report.

Next, click on the paper and pencil icon to access the customize column area.

A new box will pop up for you to fill out. This is the basis for your custom column.

The fields for this box are:
- Custom Header: The heading on the report, on one or two lines.
- Column Formula: A formula that references the columns on this report by number. This is for printing to all outputs, including Excel.
- Number Format: Choose the width and format of the output. Select from pre-created options using the drop-down box or input your own using the fields provided.
- Excel Formula: A formula that references the columns on this report by Excel column name (A-ZZZ). <note important>Only works when the report is printed to Excel.</note>
- Excel Format: A custom format for Excel columns that uses Excel's built-in column types.
Column Formula
Hover over the Column Formula field to see the instructions for creating a custom calculation.

Place the number of each column you reference in regular parentheses (#).
Use curly brackets to indicate mathematical functions {(14)-(12)}

In the column we have created, we are taking the values of column 14 (Sale Price) minus the values of column 12 (Purchase Price) and multiplying the result by column 7 (Weight in Lb).
Number Format
Excel Formula
Hover over the Excel Formula field to see the instructions for calculating a custom column for output to Excel.

The Excel formula relies on the alphabetical nomenclature that Excel uses (A-Z, then AA-ZZ, etc.).
Enter the Excel names of the columns followed by the number of the row to start with in parentheses.A(10). Use A(?) to calculate for the whole column.
Enter mathematical expressions using parentheses as well (N(?)-L(?)).

Excel Format

Hover over the field for Excel Format to see instructions for how to find a custom Excel Format.
Printout Settings
By clicking on the gear icon, you can see the current printout settings for this report.

For more detailed examples of each report option setting, click here.
Report Header Options
On the left, we have Report header options. Use these options to simplify the printout of the report and remove confusing or confidential information from the header.
- Report header: Select the type of report header to display.
- Standard: Print the standard report header with the report title and description at the top of the report.
- Customer: Print the letterhead and customer name and address as the report header. You can enter the customer account code and select the address to use.
- None: Do not print the report header information on the report.
- Bottom: Display the standard report header at the end of the report.
- Display record count in report header: Checked displays the number of records printing on the report.
- Display CATS version in report header: Checked displays the CATS version you are printing from.
- Display As Of Date in report header: Checked shows the As Of Date in the report header.
- Display selections in report header: Shows the filters and group/subtotal options in the report header.
- Password for XLS/DOC/PDF: Password to use to encrypt document output.
Styles & Colors
In the center, these options control HTML output settings.
- Styles & Colors: Choose an HTML style for this report format or use the system default.
- Column header: Standard (mixed lines), two lines, or one line. One line makes merging cells and maneuvering in Excel easier.
- HTML borders: Choose when to see borders between boxes of values when printing to HTML.
- Date Separator: Standard (whatever the CATS default is for your system), Slash “/”, or Dash “-”.
- Print double spaced: Turn on to print a space between each line (when printing to a printer ONLY).
- Wrap columns when printing to a printer: Wraps columns that would otherwise be off the page.
- Separator character and Margin - For use when printing to a printer.
More Options
On the right, we have more options for printed and HTML reports.
- Cross-tab position: If this report is available as a “cross-tab” report, chooses where to display it.
- Totals: Subtotal display options.
- Subtotal Label: Choose where/if to see the label on the subtotal groupings.
- Underlining: Pick Yes to underline totals in groups.
- Use code values for total labels: If checked, replaces labels with codes instead of full names.
- Store results for difference reporting: If checked, this report will be recorded for the purposes of recalling later using difference reports.
- ====Printing the Report====
Use the buttons on the top menu screen to print the report.

File - The CATS main menu. Selecting an option here exit the report designer and revert all your changes to the current report format.
Print… - Select the output using the standard print dialog.
The following menu options will open the report in the style that you prefer. Any option you choose will ask if you want to save the report. See Saving a Report Format below.
- Printer - Use this to print hard copy to the printer you have selected.
- HTML - Opens in HTML format.
- Word - Create a word document.
- Excel - Create an excel document.
- PDF - Create a PDF.
- Email - Email this report as an attachment.
- Email Me - Email the report to the users email.
- Local - Save a text file to the user's local drive.
- CSV - Output the report data as a CSV file.
- Text - Save a text file to the user's output directory.
- Other
- Alternate Printer - Send output to your alternate physical printer.
- Transfer File - Save a printer file in the CATS transfer directory.
- Fax - Save a printer file to the CATS fax directory.
- Delete Transfer Files - Delete all files in the CATS transfer directory.
Saving a Report Format
There are three ways to save a report:
1. CATS will prompt you to save after printing a report if you are coming from the report designer screen.
2. If you click on the Save icon (an image of a file) on the top of the report, you can save this report format.
3. If you make any changes to the report format in the designer, then pick Exit from the top of the screen, CATS will prompt you to save the report.
You can either save with the same name, or you can enter a different report name to create a new report format and leave the old one untouched.

Save After Printing
After you print, CATS will offer you three options involving saving the report:

- Continue editing: Returns you to the report designer to continue modifying the report and print again.
- Save and close: Saves the report format with the name you have entered and closes the report designer.
Enter a report format name to save this format. - Close without saving: Reverts all changes to the report format and closes the report designer.